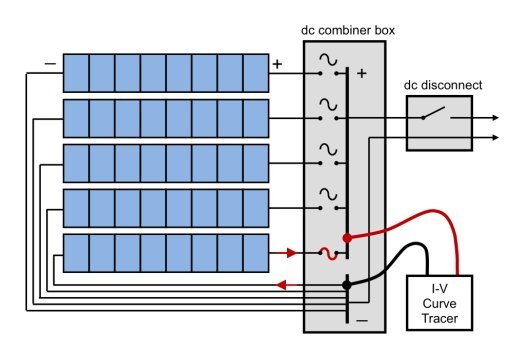
Measuring string I-V curves at the combiner box
Measuring string performance always involves isolating and connecting to the string you want to measure. As an example, these are the steps for measuring strings at the combiner box in a negative-grounded array. See Figure 1
- Shut down the inverter (if required by system operating policy)
- Open the dc disconnect switch for the PV combiner box at which measurements will be made
- Lift all of the string fuses
- Connect the test leads of the I-V curve tracer to the positive and negative bus bars, observing polarities.
At this point the electrical configuration is as shown in Figure 2.
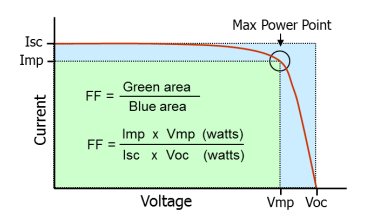
Figure 2: Definition of the fill factor, a performance metric that represents the square-ness of the I-V curve and expresses the PV source’s ability to generate power in relation to Isc and Voc.
Since the positive bus bar is isolated from the rest of the array by the open dc disconnect switch, the fuses can be inserted one at a time to select circuits to be measured.
Perform this sequence for each string to be measured:
- Select a string by inserting its fuse.
- Take the I-V curve measurement.
- Inspect the results. If there is a performance issue, you have the option to troubleshoot immediately or wait.
- Save the results.
- Lift the string fuse.
- Repeat the sequence for each remaining string in the combiner box.
Deploying the irradiance sensor
Mount the irradiance sensor in the plane of the array. On partially cloudy days, mount the sensor close enough to the strings under test to assure that strings and sensors are ‘seeing’ the same irradiance at the instant of the measurement. If the string under test is in sun and the irradiance sensor is clouded, or vice versa, there will be poor agreement between measured and expected performance.
Select a sensor location that has an open view of the sky. This is especially important under hazy, overcast or partially cloudy conditions where a significant amount of the irradiance is diffuse, that is, arriving at the sensor (and the PV modules) from all directions in the sky. If under these conditions part of the sky is blocked from the view of the sensor by an adjacent tree or building, or by part of the array itself, the sensor will under-predict PV output.
The selected sensor mounting location should also be free of reflected light (albedo). Common sources of reflected light include the PV support structure, buildings, cars, pavement and so on. In parking canopy arrays, mounting the irradiance sensor magnetically to the side of an end purlin can have the double disadvantage of blocking diffuse light from part of the sky and reflecting additional direct sunlight onto the sensor.
If the sensor is designed to be surface-mounted, placing the sensor on one of the modules in the array will also assure proper alignment. Be sure not to place the irradiance sensor on a module under test, as it will shade the cells and produce a step in the I-V curve.
Deploying the temperature sensor
If a module backside temperature sensor is being used, attach it with high temperature tape to assure that it stays in firm contact with the module backsheet for the duration of the measurements. Common plastic duct tape or electrical tape will sag and stretch under hot conditions, allowing an air gap to form between the sensor and the backsheet, which in turn causes a large temperature error.
Temperature is not uniform across an array. The edges run cooler, and the top edge may be warmer than the bottom edge and sides, where cooler air is drawn in by convection. Attach the temperature sensor at a location that represents the average temperature for the strings under test.
Avoid attaching surface temperature sensors to the face of the module, where they will shadow the cells and affect the measured performance.
If an infrared thermometer is being used, avoid thermal reflections by placing the sensor in direct contact with the surface of the glass. Module glass is not transparent in the wavelength range of IR thermometers, so the measured value represents the temperature of the outer surface of the glass, not the temperature of the cells. Adjust the thermometer’s emissivity setting to 0.92, the emissivity of glass.
Physical contact and IR measurements both have the limitation that they measure surface temperatures. The temperature of interest for analyzing string performance data is the average PV cell temperature, which is typically a few degrees Celsius warmer than the backside or frontside surface temperatures. Data analysis should take these temperature offsets into account.