CURRENT STATUS
Edmund Becquerel discovered the photovoltaic (PV) effect in 1839, when he observed that a voltage and a current were produced when a silver chloride electrode immersed in an electrolytic solution and connected to a counter metal electrode was illuminated with white light (Becquerel 1839). However, the birth of the modern era of PV solar cells occurred in 1954, when D. Chapin, C. Fuller, and G. Pearson at Bell Labs demonstrated solar cells based on p-n junctions in singlecrystal Si with efficiencies of 5–6% (Chapin, Fuller, and Pearson 1954). This original Si solar cell still works today — single-crystal Si solar cells dominate the commercial PV market.
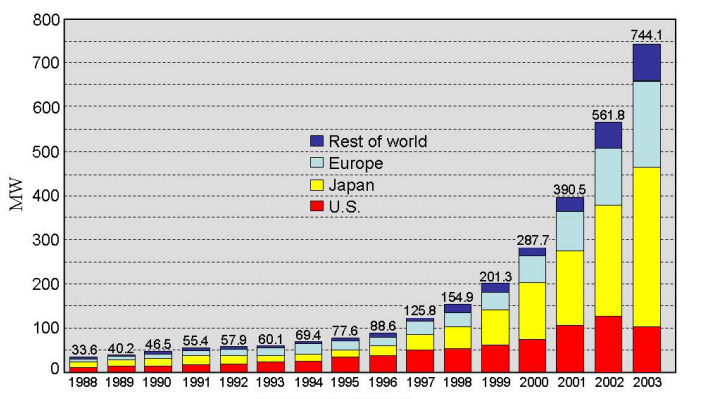
From the mid 1950s to the early 1970s, PV research and development (R&D) was directed primarily toward space applications and satellite power. Then, in 1973, a greatly increased level of R&D on solar cells was initiated following the oil embargo in that year, which caused widespread concern regarding energy supply. In 1976, the U.S. Department of Energy (DOE), along with its Photovoltaics Program, was created. DOE, as well as many other international organizations, began funding PV R&D at appreciable levels, and a terrestrial solar cell industry quickly evolved. Figure 1 shows a plot of annual PV power production vs. time for the period 1988–2003 (Surek 2005). Total global PV (or solar) cell production increased from less than 10 MWp/yr in 1980 to about 1,200 MWp/yr in 2004; the current total global PV installed capacity is about 3 GWp. The “peak watt” (Wp) rating is the power (in watts) produced by a solar module illuminated under the following standard conditions: 1,000 W/m2 intensity, 25°C ambient temperature, and a spectrum that relates to sunlight that has passed through the atmosphere when the sun is at a 42° elevation from the horizon (defined as air mass [or AM] 1.5;
i.e., when the path through the atmosphere is 1.5 times that when the sun is at high noon). Because of day/night and time-of-day variations in insolation and cloud cover, the average electrical power produced by a solar cell over a year is about 20% of its Wp rating.
Solar cells have a lifetime of approximately 30 yr. They incur no fuel expenses, but they do involve a capital cost. The cost for the electricity produced by the cell is calculated by amortizing the capital cost over the lifetime of the cell and considering the total electrical output energy produced over the cell lifetime. Higher PV efficiency thus directly impacts the overall electricity cost, because higher-efficiency cells will produce more electrical energy per unit of cell area over the cell lifetime. The cost figure of merit for PV cell modules ($/Wp) is determined by the ratio of the module cost per unit of area ($/m2 ) divided by the maximum amount of electric power delivered per unit of area (module efficiency multiplied by 1,000 W/m2 , the peak insolation power). In Figure 2, this cost per peak watt ($/Wp) is indicated by a series of dashed straight lines having different slopes. Any combination of areal cost and efficiency that is on a given dashed line produces the same cost per peak watt indicated by the line labels. Present single-crystalline Si PV cells, with an efficiency of 10% and a cost of $350/m2 , thus have a module cost of $3.50/Wp. The area labeled I in Figure 2 represents the first generation (Generation I) of solar cells and covers the range of module costs and efficiencies for these cells.
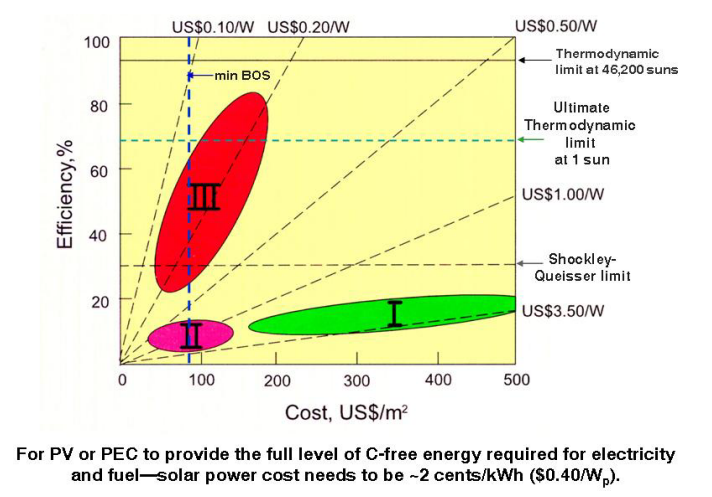
In addition to module costs, a PV system also has costs associated with the non-photoactive parts of the system. These are called balance of system (BOS) costs, and they are currently in the range of $250/m2 for Generation I cells. Thus, the total cost of present PV systems is about $6/Wp. Taking into account the cost of capital funds, interest rates, depreciation, system lifetime, and the available annual solar irradiance integrated over the year (i.e., considering the diurnal cycle and cloud cover, which produces an average power over a year that is about 1/5 of the peak power rating), the $/Wp cost figure of merit can be converted to $/kWh by the following simple relationship: $1/Wp ~ $0.05/kWh. This calculation leads to a present cost for grid-connected PV electricity of about $0.30/kWh. Areas labeled II and III in Figure 2 present the module costs for Generation II (thin-film PV) and Generation III (advanced future structures) PV cells.
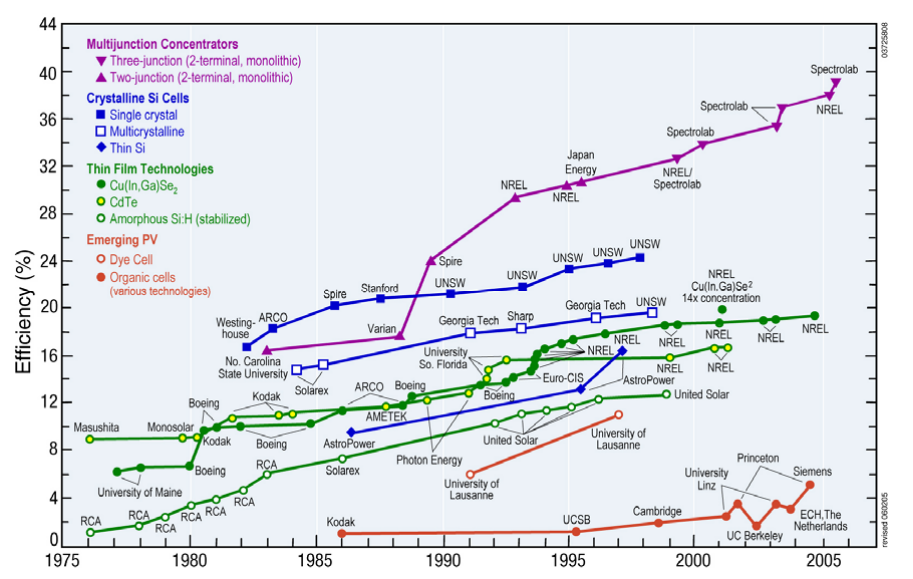
Figure 3 presents the historical progress of the best reported solar cell efficiencies to date (Surek 2005). The efficiencies of commercial (or even the best prototype) modules are only about 50– 65% of the efficiency of the best research cells. The plot includes the various PV technologies of single-crystal Si, thin films, multiple-junction cells, and emerging technologies — such as dyesensitized nanocrystalline TiO2 cells and cells based on organic compounds.
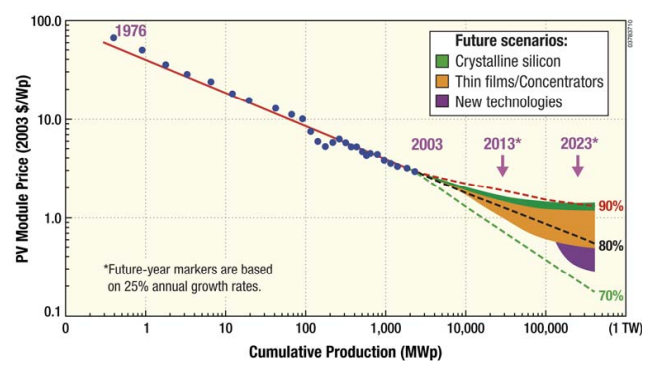
Over the past decades, improvements have also been made in a second important metric, the manufacturing cost of PV modules. The prices of PV modules have followed a historical trend along a so-called “80% learning curve.” That is, for every doubling of the total cumulative production of PV modules worldwide, the price has dropped by approximately 20%.
News (PV Energy Systems 2004). The final data point for 2003 corresponds to about $3.50/Wp and a cumulative PV capacity of 3 GW. An important issue, in terms of future projections, is how this price-reduction trend will continue in the future. As Figure 4 shows, a major reduction in the projected future cost of PV modules depends upon the introduction of thin films, concentrator systems, and new technologies.
The third significant metric for PV cells is module reliability. Today, most crystalline Si module manufacturers offer warranties of 25 years, typically guaranteeing that the power output of the module will not decrease by more than 20% over this period.
IMPACT OF INEXPENSIVE SOLAR ELECTRICITY
In 2004, the United States consumed approximately 4.0 × 10¹² kWh (energy consumed in one year at an average power of 0.46 TW) of electricity (Energy Information Administration; this amount represents about 14% of total U.S. energy consumption . The U.S. electricity produced by solar PV cells currently represents a tiny fraction (<0.02%) of the total electricity supply. The challenge for generators of solar electricity is to produce it at very low cost, ultimately approaching $0.40/Wp, which is equivalent to an energy cost of $0.02/kWh. Achieving this cost would require a reduction in the $/Wp price of about a factor of 15–25 ><0.02%) of the total electricity supply. The challenge for solar generators of electricity is to produce it at very low cost, ultimately approaching $0.40/Wp, which is equivalent6 to an energy cost of $0.02/k Wh. Achieving this cost would require a reduction in the $/Wp price of about a factor of 15-25 relative to present PV costs. Such a low cost for solar electricity would be expected to result in massive implementation of solar energy systems in the energy infrastructure in the United States and globally. Such a cost breakthrough would also represent a major advance in using solar energy to alleviate the anticipated future problems associated with energy supply, energy security, and unacceptable levels of atmospheric CO2. In addition to satisfying electrical power needs, solar electricity at $0.02/kWh could also contribute to the goal of producing cost-effective non-carbonaceous solar fuels, such as hydrogen (National Academy of Engineering, Board on Energy and Environmental Systems 2004). However, to achieve the latter goal, major advances in suitable and scalable storage and distribution technologies will also be required.
Solar electricity can be produced from PV cells or from turbines operating with high-temperature steam produced from concentrated solar power. This Panel Survey addresses only PV solar cells; the latter method for producing solar power is discussed in the section on Basic Research Challenges for Solar Thermal Utilization.
Need for Revolution on Existing Technology Path
Since the 1970s, the PV industry has continually reduced the cost of solar electricity. Over the past three decades, the cost of PV modules has decreased at a rate of 20% for each doubling of module production (see Figure 4). The cost of PV modules per peak watt has declined from about $70/Wp in 1976 to about $3.50/Wp in 2003. The BOS cost (support structures, maintenance, land, etc.) for a grid-tied PV system is about $2.50/Wp. Considering both module and BOS costs, together with present cell efficiencies, the cost of solar electricity has dropped from about $3.65/kWh in 1976 to about $0.30/kWh in 2003. However, if the present learning curve for PV cells is followed, the projected attainment of very-low-cost PV power ($0.02/kWh) and its widespread implementation would lie far in the future (20–25 years depending upon the annual production growth rate; see Figure 5). Therefore, basic research is needed to not only maintain the existing technology path and learning curve in support of evolution, but to also produce a revolution to dramatically change the slope of the historical learning curve and produce dramatic reductions in the PV module cost-to-efficiency ratio (Figure 5). The goal is to reduce the cost per peak watt by a factor of about 15–25 relative to present systems through the use of new designs, materials, and concepts for solar electricity production, and to do so more quickly than would be accomplished by staying on the existing learning curve — thereby materially impacting global energy supply in 10–15 years rather than by the mid-21st century.
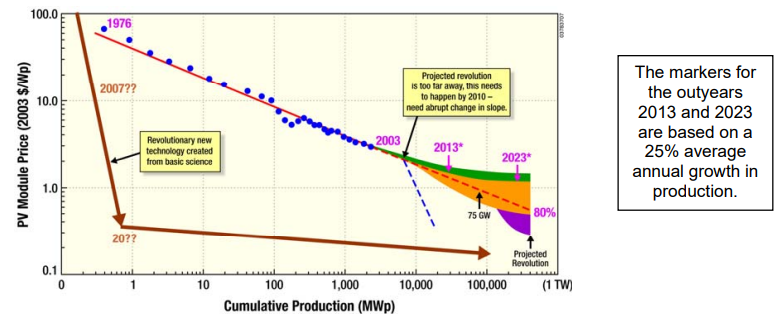
The module price has been dropping 20% for every doubling of module production (80% learning curve) since 1976. Extrapolation of this historical trend into the future, plus a projected technological revolution at an annual production level of 150,000 MWp, results in a prediction that $0.40/Wp would not be reached for another 20–25 yr. Reaching $0.40/Wp sooner to accelerate large-scale implementation of PV systems will require an intense effort in basic science to produce a technological revolution that leads to new, as-yet-unknown technology. This revolution requires a major reduction in the ratio of the PV module cost per unit area to the cell efficiency.
The following paragraphs describe the basic research that is required to produce breakthroughs that would change the slope of the learning curve and accelerate cost reduction.
Needs of the Si Photovoltaic Industry. More than 99% of today’s PV production is Si based, with the best performance coming from the highest-quality single crystals and the lowest performance from amorphous Si cells. Because of the inherent costs of making and handling wafers, the production cost would be substantially reduced if high-quality crystals could be obtained by thin-film growth on glass or on another inexpensive substrate. Thin-film crystalline Si on glass is now used for some display technologies. An exciting research opportunity would use this thin-film Si technology to grow high-efficiency solar cells at the cost of amorphous Si cells. Even though Si technology is considered to be relatively mature, planar, one-sun Si cells have recently set new performance records by use of heterointerfaces with amorphous Si to passivate the surfaces and withdraw carriers. Further improvements in performance are presently limited because researchers do not yet understand the mechanisms of this improvement.
Needs of Direct-gap, Thin-film Photovoltaic Technologies. A second strategy for reducing costs is to use thin-film materials that have a very high absorptivity for solar photons. Such materials are called direct-band-gap semiconductors; Si is an indirect-band-gap semiconductor and absorbs relatively weakly, thus requiring a relatively large thickness of Si in the PV cell to absorb all the incident sunlight. Substantial research efforts have produced direct-band-gap CdTe and CuInSe2 solar cells with efficiencies approaching 20%. Industrial efforts to manufacture cells made of these materials in high volumes are beginning to demonstrate success. However, this process has been slower than expected because much of the basic science of these solar cells is not understood. These polycrystalline solar cells are affected by many things, including the grain structure obtained for growth on foreign substrates, the effects of intentional and unintentional impurities on doping and performance (e.g., injection of sodium affects the performance of CuInSe2 cells), and the nature of the active junction and ohmic contacts formed by poorly understood processes. A basic understanding of these issues would facilitate the technology transfer to large-scale production, enabling a revolutionary growth of the PV industry.
Needs of Concentrator Cell Technology. A third strategy would reduce costs by using inexpensive optics to concentrate the light on small-area solar cells. Four recent achievements/developments provide a foundation and momentum:
- An efficiency of 37.9% has been obtained, with possible pathways to higher efficiencies.
- Lattice mismatched III-V solar cells with performance approaching the radiative limit have been demonstrated, implying that such cells may reach efficiencies in the 40–50% range.
- A 1-kW multi-junction concentrator system is now supplying electricity to the grid, paving the way for larger prototypes and manufacturing; and
- In 2004, installations with sizes >100 kW increased to 20 MW, implying that a market appropriate for concentrators may be emerging.
Taken together, these recent developments imply that concentrator cell technology may be poised for rapid growth. Key to this growth is the integration of multiple materials for fabrication of higher-efficiency solar cells.
Need for Revolution to Create New Technologies
In addition to investing in basic research to support a slope change in the present evolutionary path of existing PV technologies — including crystalline Si, thin-film approaches, and multiplejunction tandem cells — an aggressive, high-risk research program must be developed for as-yetunknown or nascent approaches to solar energy conversion. Such a research effort must target the development of inherently high-efficiency and low-cost conversion concepts to rapidly achieve dramatic improvements in the economics of solar energy. This strategy is illustrated in Figure 5.